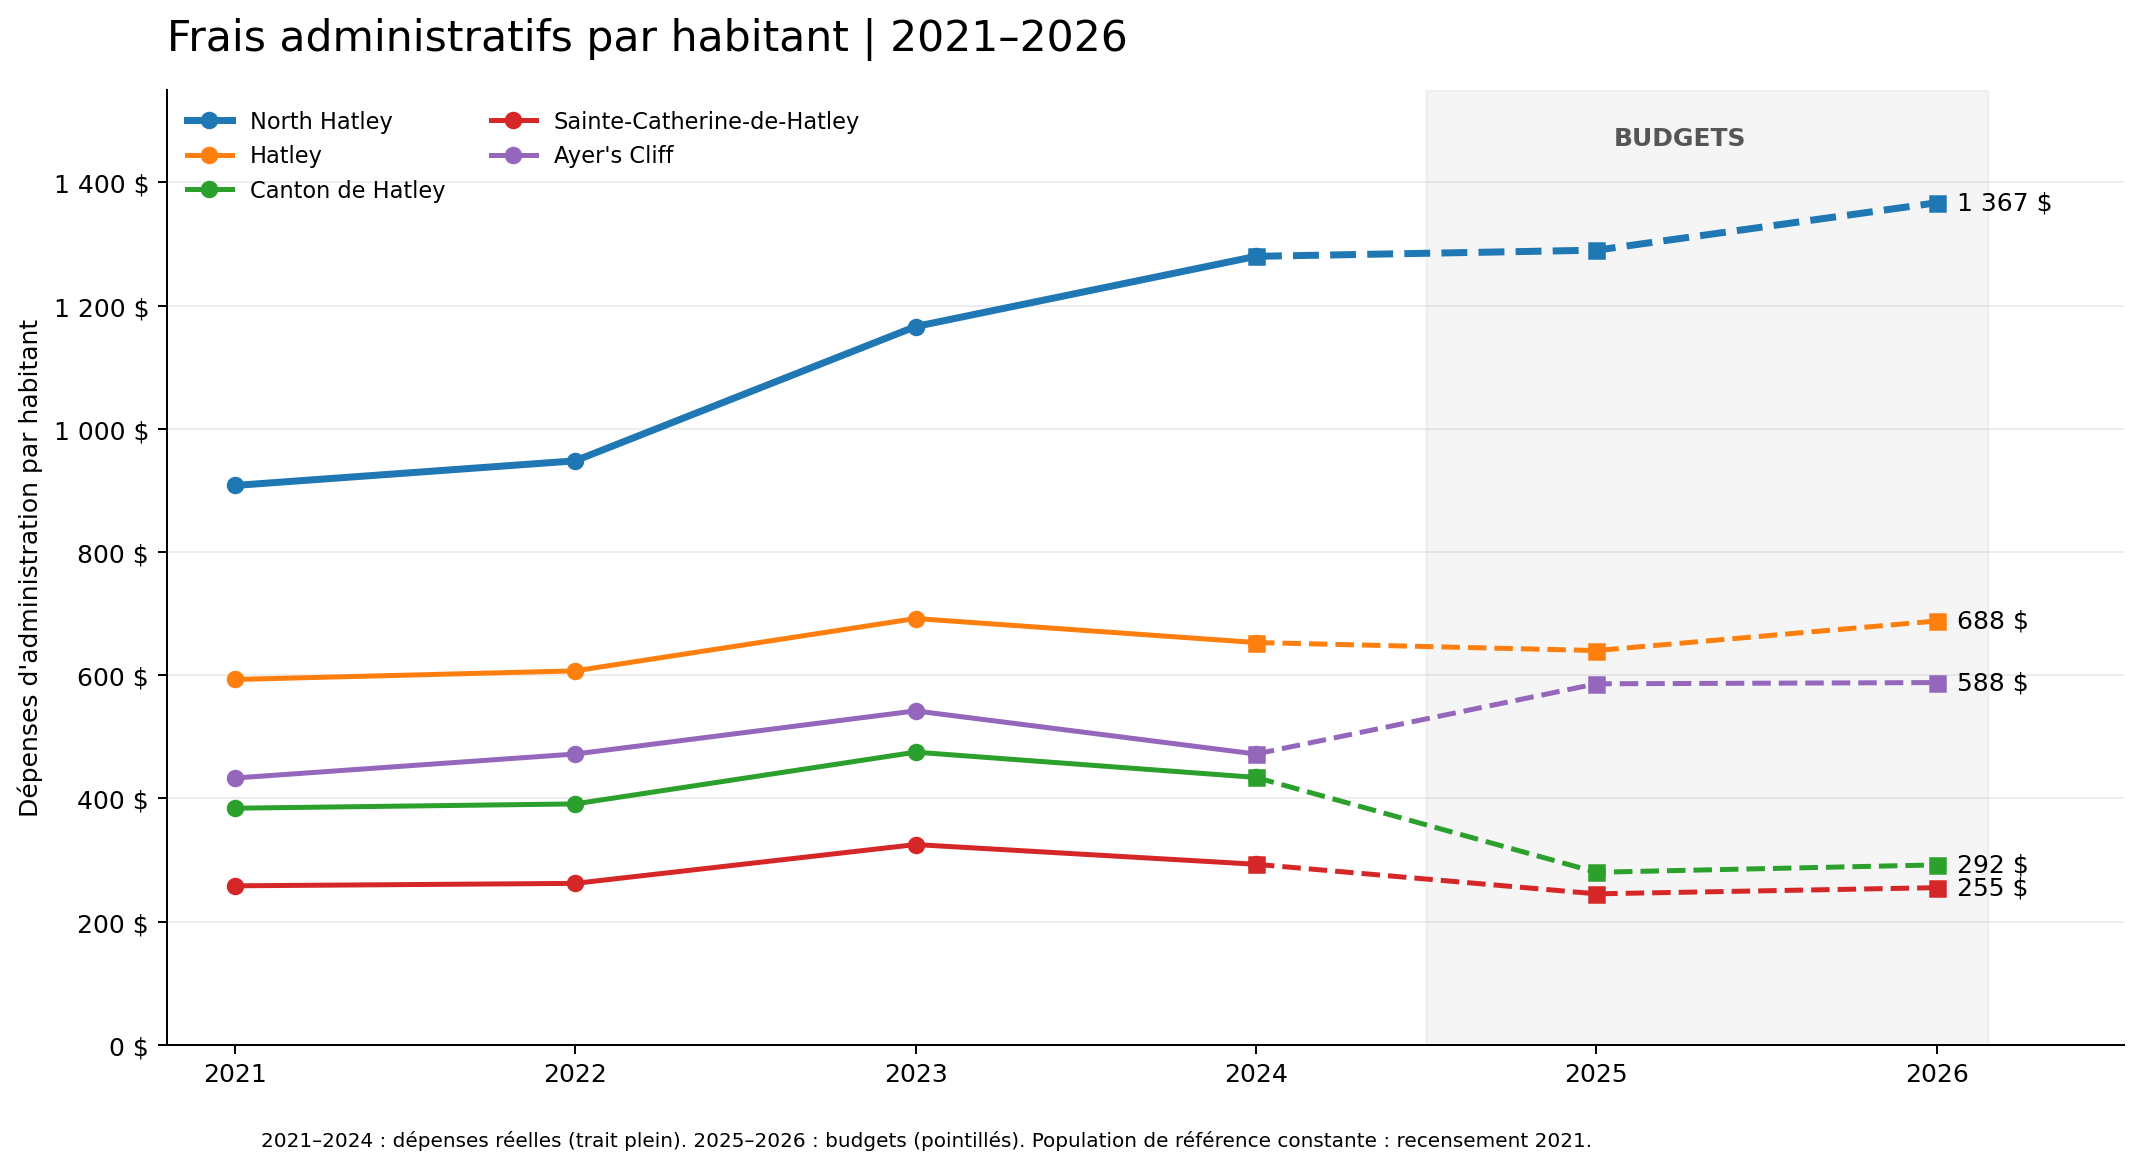
Between 2021 and the 2026 budget, North Hatley’s general administration expenses increased from $612,813 to $922,837, representing a 50.6% increase. How does this trend compare with Hatley, the Township of Hatley, Sainte-Catherine-de-Hatley, and Ayer’s Cliff?
To answer this question, I compiled the administrative expenses of all five municipalities over a six-year period, using their financial reports from 2021 to 2024, along with their municipal budgets for 2025 and 2026.
The objective is to make this public financial information more accessible and allow residents to track how their municipality’s administrative expenses have evolved over time.
Why Compare Administrative Expenses Per Capita?
Comparing total expenditures alone can provide an incomplete picture of the situation.
A municipality with 675 residents and another with 2,741 residents do not necessarily have the same administrative needs, infrastructure, or organizational structure.
To make the figures easier to compare, I divided each municipality’s annual general administration expenses by its population.
I used a consistent population baseline based on the 2021 Census to measure changes in administrative spending without population fluctuations affecting the results.
The reference populations are as follows:
| Municipality | Reference Population (2021) |
|---|---|
| North Hatley | 675 |
| Hatley | 771 |
| Township of Hatley | 2,230 |
| Sainte-Catherine-de-Hatley | 2,741 |
| Ayer’s Cliff | 1,180 |
Evolution of Administrative Expenses Per Capita from 2021 to 2026
The following table shows administrative expenses per resident for each of the five municipalities.
| Municipality | 2021 | 2022 | 2023 | 2024 | 2025 Budget | 2026 Budget |
|---|---|---|---|---|---|---|
| North Hatley | $908 | $948 | $1,166 | $1,280 | $1,290 | $1,367 |
| Hatley | $593 | $607 | $692 | $653 | $640 | $688 |
| Township of Hatley | $384 | $391 | $475 | $434 | $280 | $292 |
| Sainte-Catherine-de-Hatley | $258 | $262 | $325 | $293 | $245 | $255 |
| Ayer’s Cliff | $433 | $472 | $542 | $472 | $586 | $588 |
The 2021–2024 figures represent actual expenditures reported in municipal financial statements, while the 2025 and 2026 figures reflect budgeted expenditures. All per capita amounts are rounded to the nearest dollar.
Comparative Chart: Trends from 2021 to 2026
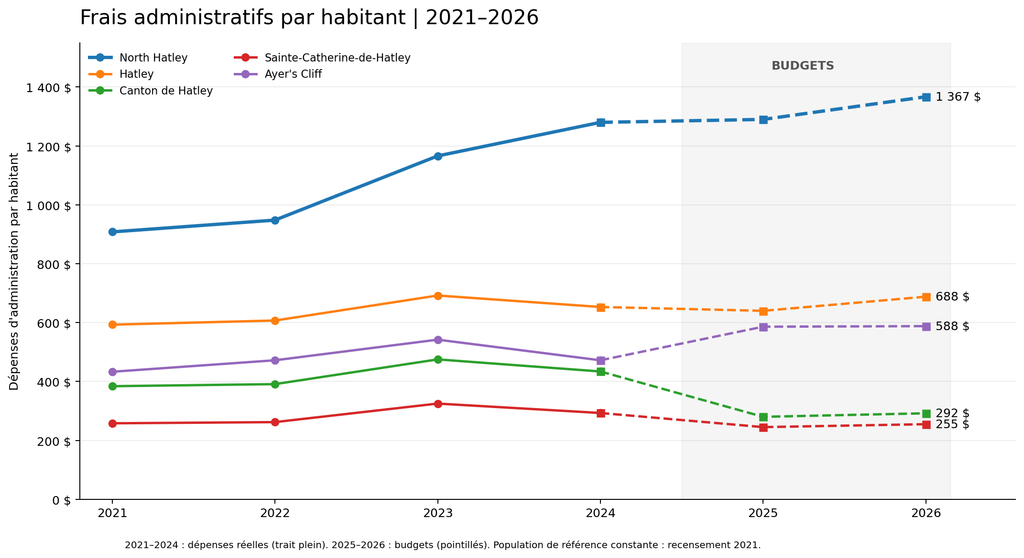
Solid lines represent actual expenditures from 2021 to 2024, while dashed lines represent the adopted budgets for 2025 and 2026.
North Hatley: A 50.6% Increase Between 2021 and the 2026 Budget
Let’s now take a closer look at how North Hatley’s general administration expenses have evolved.
| Year | General Administration | Cost per Capita | Data Type |
|---|---|---|---|
| 2021 | $612,813 | $908 | Actual |
| 2022 | $640,111 | $948 | Actual |
| 2023 | $786,753 | $1,166 | Actual |
| 2024 | $863,727 | $1,280 | Actual |
| 2025 | $870,424 | $1,290 | Budget: Revenues / Expenditures |
| 2026 | $922,837 | $1,367 | Budget |
Between 2021 and 2024, North Hatley’s actual administrative expenses increased by $250,914, or approximately 40.9%.
When the 2026 budget projections are included, the difference compared with 2021 reaches $310,024, representing a 50.6% increase.
For the 2025–2026 budget period alone, an additional increase of $52,413 is projected, representing a 6.02% rise.
Based on our reference population of 675 residents, administrative expenses have therefore increased from $908 per capita in 2021 to $1,367 in the 2026 budget.
It is important to note, however, that the 2026 figure remains a budget projection rather than an actual expenditure recorded at the end of the fiscal year.
What Do the 2026 Budgets of Neighbouring Municipalities Project?
We also reviewed the official budget documents of each of the four municipalities included in this comparison.
Here are the projected general administration expenses for 2026:
| Municipality | 2026 General Administration Budget | Cost per Capita |
|---|---|---|
| North Hatley | $922,837 | $1,367 |
| Hatley | $530,755 | $688 |
| Township of Hatley | $650,991 | $292 |
| Sainte-Catherine-de-Hatley | $699,911 | $255 |
| Ayer’s Cliff | $694,172 | $588 |
There are significant differences in per capita amounts.
However, it is important to keep in mind that municipalities do not necessarily present their budgets using an identical breakdown of expenses. Certain expenditures, particularly elected officials’ remuneration, may be reported under separate budget categories.
These figures should therefore be viewed as a comparative indicator rather than a definitive measure of administrative efficiency.
How Have Administrative Budgets Changed Between 2025 and 2026?
The inclusion of the official budgets also makes it possible to compare the projected changes between the two fiscal years.
| Municipality | 2025 Budget | 2026 Budget | Change |
|---|---|---|---|
| North Hatley | $870,424 | $922,837 | +6.02% |
| Hatley | $493,221 | $530,755 | +7.61% |
| Township of Hatley | $625,477 | $650,991 | +4.08% |
| Sainte-Catherine-de-Hatley | $671,580 | $699,911 | +4.22% |
| Ayer’s Cliff | $691,886 | $694,172 | +0.33% |
For Hatley, the 2025 figure corresponds to the original budget published in December 2024. The 2026 budget document presents a different comparative figure for 2025 ($483,387). We have retained the original budget to ensure a consistent approach across all municipalities.
What Explains General Administration Expenses?
The “General Administration” category may include several types of expenses, such as:
- Administrative salaries and employee benefits;
- Financial management and accounting;
- Clerk’s office and administrative services;
- Legal fees and professional services;
- Insurance, telecommunications, and IT tools;
- Office supplies, training, and other operating expenses.
The exact breakdown of these expenses may vary from one municipality to another.
In North Hatley’s case, it would be particularly useful to review a detailed breakdown of changes in administrative salaries, employee benefits, legal fees, and professional services between 2021 and 2026.
This information would provide a clearer understanding of which expense categories account for the increases observed.
Legitimate Questions About Rising Expenses
The figures presented raise several questions that could benefit from further explanation in budget documents or during municipal council meetings.
Which budget categories are primarily responsible for the increase in North Hatley’s administrative expenses since 2021?
What proportion of this increase is attributable to salaries and employee benefits?
How have legal fees and professional services expenses evolved over this period?
Are some of these expenses one-time costs, or are they expected to recur in future fiscal years?
A more detailed presentation of these items would help residents better understand the municipality’s administrative expenses.
Conclusion: The Importance of Comparing Consistent Data
This analysis tracks six years of administrative expenses across five neighbouring municipalities.
For North Hatley, the figures show an increase in actual expenditures between 2021 and 2024, followed by further increases projected in the 2025 and 2026 budgets.
However, it remains essential to distinguish actual expenditures from budget projections and to account for differences in how municipalities classify their expenses.
Administrative costs per capita alone are not sufficient to assess the quality of municipal services or management. Nevertheless, they provide a useful tool for understanding trends in local public finances and encouraging informed community discussions based on concrete data.
Sources and Methodology
Actual Expenditures, 2021–2024:
Comparative Compilation of Municipal Financial Reports Published on NorthHatley.info.
2025 and 2026 Budgets:
- North Hatley: 2026 Municipal Budget.
- Hatley: 2025 and 2026 Municipal Budgets.
- Township of Hatley: 2026 Budget and Taxes.
- Sainte-Catherine-de-Hatley: 2026 Municipal Budget.
- Ayer’s Cliff: 2026 Budget and Three-Year Capital Expenditure Plan (2026–2028), presented on December 1, 2025.
Calculation Method:
General administration expenses ÷ reference population from the 2021 Census.
Per capita figures are rounded to the nearest dollar. Municipal budgets may differ in how expenses are classified and reported, which should be taken into consideration when interpreting these figures.
Clarify actuals versus budgets earlierAdd the key comparative takeaway